Contact Data Quality Metrics Every RevOps Team Should Track
Table of Contents
Explore Bitscale
Find decision makers, more insights and contact information about this company on Bitscale
Data quality metrics are measurable indicators that score the accuracy, completeness, freshness, uniqueness, and consistency of contact and company records. They expose exactly where breakdowns silently degrade GTM workflows: outbound sequencing, lead routing, pipeline reporting, and everything downstream.
You know the scene. Reps burn hours on bounced emails and wrong titles. Marketing blames Sales for low conversion. Leadership blames "messaging." Nine times out of ten the real culprit is data quality, but nobody can prove it because nobody is measuring it.
That changes the moment you treat contact and company data like operational assets with quantifiable health. Below: the metrics that matter, the formulas behind them, what "good" actually looks like, and how to build a measurement rhythm your team will maintain past the first week.
What are data quality metrics?
Data quality metrics are not "data quality" itself. They are the scoreboard. They tell you which fields are decaying, which sources are polluting your CRM, and which database segments are unfit for the workflows they feed. Without them, you are guessing. IBM defines data quality broadly as data being fit for its intended use, and a frequently cited Gartner estimate pegs the cost of poor data quality at $12.9 million per organization annually. A CRM enrichment strategy is a primary way to combat this decay. Six core dimensions appear in most data quality frameworks: accuracy, completeness, consistency, timeliness, validity, and uniqueness. Metrics turn those dimensions into numbers you can track week over week, often managed through a data cleaning process that runs before enrichment. This ensures your data enrichment tools work on a solid foundation.
The ISO 8000 standard formalizes these concepts internationally, defining requirements for data exchange and portability. You don't need the full standard to benefit from its logic: pick the dimensions relevant to your GTM motion, assign a formula to each, and start measuring.
Why data quality metrics matter (and why pretty dashboards don't)
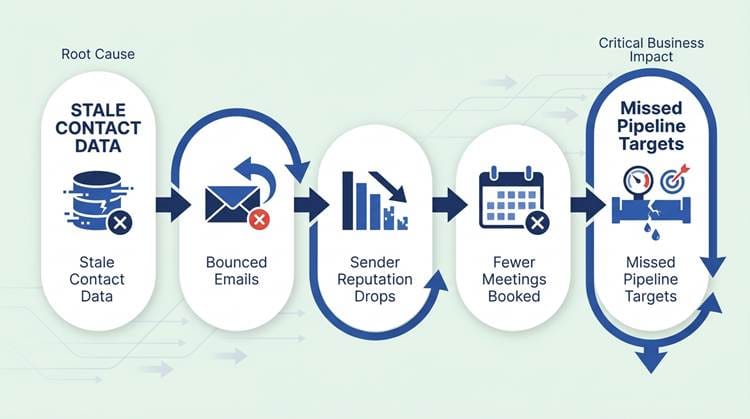
Bad data doesn't just waste time; it compounds into pipeline-level damage.
A dashboard that reads "data health: 87%" without context is decoration. Metrics earn their keep when they connect to outcomes: deliverability rates, connect rates, routing accuracy, territory fairness, attribution integrity, pipeline hygiene. MIT Sloan research estimates companies lose 15% to 25% of revenue due to bad data. These are not abstract losses. They show up as wasted SDR seats, misfired sequences, and false negatives in ICP targeting (your best accounts never get touched because firmographic fields are wrong).
The organizational value is just as real. Data quality metrics create a shared language between Sales, Marketing Ops, RevOps, and Data teams. Once everyone agrees on what "completeness" means and where the threshold sits, finger-pointing drops and remediation speeds up.
The contact data quality metrics that actually move revenue
Contact-level metrics are where outbound and inbound workflows live or die. Four dimensions deserve the most attention.
Accuracy covers email validity, phone reachability, role/title correctness, and company-to-contact linkage. If your SDR is emailing a VP of Engineering who left eight months ago, accuracy has failed. Measuring B2B contact data accuracy at the field level (not just the record level) is the only way to catch these issues before they hit a sequence.
Completeness measures coverage of the fields required for routing and personalization: persona, seniority, department, location, LinkedIn URL. A record with a valid email but no seniority tag can't be routed to the right rep or personalized beyond "Hi {first_name}." Completeness without accuracy is, to be blunt, confident nonsense. Both matter.
Freshness tracks how recently a record was verified. Job titles decay fast (average VP tenure is roughly 2.5 years), phone numbers change with roles, and companies get acquired. Define decay windows per field: titles might need re-verification every 90 days, while a corporate domain stays stable for years.
Uniqueness catches duplicate contacts across sources and within your CRM. Duplicates cause sequence collisions (two reps emailing the same VP on the same day), inflated pipeline counts, and broken attribution. Duplicate rate is one of the easiest metrics to baseline and one of the most impactful to fix.
Company database metrics: where account strategy quietly breaks
Company-level data quality is less visible but equally destructive. Firmographic accuracy (industry, employee count, revenue band, HQ location) drives segmentation, territory assignment, and ICP scoring. Misclassify a 50-person startup as a 5,000-person enterprise and your rep wastes a week on an account that was never in-market.
Account hierarchy integrity matters for enterprise selling. Missing parent/child relationships between subsidiaries fragment pipeline across what is actually one buying group, misroute ownership, and produce rollup reports that lie. Coverage metrics for B2B data measure the percent of target accounts with required fields (domain, HQ, tech stack, intent signals). If 40% of your Tier 1 accounts lack tech-stack data, your ABM plays are flying blind.
CRM data quality: the metrics that tell you if your system is lying
Three CRM-level metric categories to track:
● Consistency: Are picklists enforced over free text? Are country/state values standardized? When one rep logs "United States," another logs "US," and a third logs "USA," every report segmenting by country breaks.
● Integrity: Orphaned contacts (no linked account), contacts linked to the wrong account, missing domains, and conflicting fields across objects all erode trust in your system of record.
● Process alignment: Field definitions and required fields should evolve by stage. A lead record might only need email and company, but a contact tied to an open opportunity should carry seniority, department, and direct phone.
Understanding CRM data enrichment workflows helps enforce these stage-specific requirements and keep your CRM honest as records move through the funnel.
How data quality metrics work in practice
Measurement starts with a pipeline. Define your sampling strategy (full scan or statistical sample), set validation rules per field, run enrichment checks against external sources, and establish ongoing monitoring. Scoring works in layers: each field gets a pass/fail or percentage score, those roll up to a record score, then to a segment score (by source, region, persona, or team), and finally to an overall database health score.
Thresholds and SLAs give the scores teeth. If your email bounce rate crosses 3%, that triggers a remediation workflow. If duplicate rate exceeds 5% in a given import batch, the batch gets quarantined. The operational loop: detect the issue, triage by severity and source, fix it (enrich, merge, normalize), and prevent reintroduction through validation rules, form constraints, and integration controls. Waterfall enrichment is one method that improves data accuracy by cross-referencing multiple providers before writing to your CRM.
A practical metric set (and the formulas) you can steal
|
Metric |
Formula |
|
Completeness % |
(Required fields completed / Total required fields) × 100 |
|
Duplicate Rate |
(Duplicate records / Total records) × 100 |
|
Freshness % |
(Records verified within decay window / Total records) × 100 |
|
Email Validity % |
(Valid emails / Total emails checked) × 100 |
|
Bounce Rate |
(Bounced emails / Emails sent) × 100 |
Required field sets should vary by workflow. Outbound prospecting needs email, title, seniority, company, and industry at minimum. Inbound routing needs lifecycle stage, lead source, and territory-qualifying fields. Customer expansion needs product usage data, contract dates, and account hierarchy. Segment your metrics by source (vendor, form, import), by team, by region, and by ICP tier. The goal is to pinpoint where quality is breaking, not just confirm that it is.
Real-world examples: what good and bad look like
Email deliverability reality check. Industry benchmarks cite roughly 2% as a healthy bounce rate for cold outreach. When that number creeps to 5% or 8%, it almost always signals stale contact data or absent validation at capture. A team sending 10,000 emails per month at an 8% bounce rate burns 800 sends, damages sender reputation, and trains inbox providers to deprioritize their domain. I've watched a team's meeting-booked rate jump 22% simply by adding pre-send email validation. The data was "there" the whole time; it just hadn't been checked.
Duplicate chaos. Salesforce orgs commonly accumulate duplicates after multiple CSV imports, trade-show list uploads, and overlapping enrichment vendor syncs. The downstream effect: two SDRs email the same VP of Product on the same Tuesday, one offering a demo and the other a case study. The VP replies to neither. Attribution splits the "touch" across two sequences, making both look weaker than they are. A simple duplicate rate metric, measured after every import, prevents this entirely.
Hierarchy gaps. An enterprise account with three subsidiaries gets split across three account owners because parent/child mapping is missing. Pipeline for what is actually a $400K opportunity shows up as three separate $130K deals in three different territories. Forecasting breaks. The deal closes and nobody can agree on who sourced it. Evaluating B2B contact database companies with hierarchy data in mind helps prevent this from the start.
Common misconceptions about data quality metrics
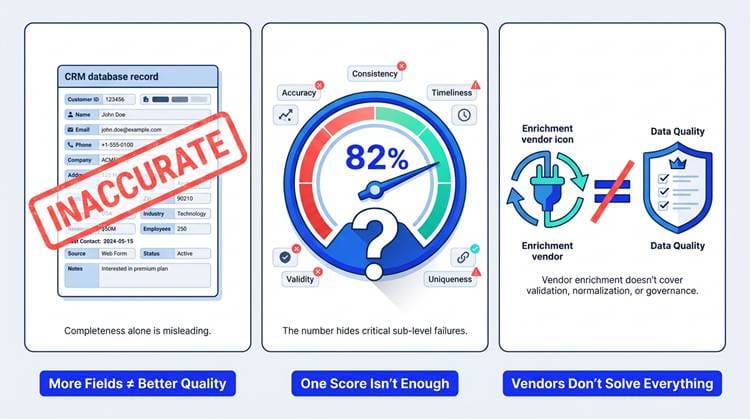
More fields, single scores, and vendor reliance are the three traps teams fall into most.
"More fields = better data quality." Completeness is one dimension, not the whole picture. A record with 30 populated fields where half are outdated or wrong scores high on completeness and low on accuracy. You end up with confidently wrong outreach. Always pair completeness with validity and freshness.
"One overall score is enough." A single number hides the signal. Your overall score might sit at 82%, but if email validity for EMEA contacts is at 60%, your European outbound is in trouble. Field-level and workflow-level views are what make a metric actionable.
"Enrichment vendors solve data quality." Enrichment fills gaps (completeness, coverage). Validation confirms correctness (accuracy). Normalization standardizes formats (consistency). Governance prevents decay (freshness). Four different activities. Expecting one vendor to handle all four is how teams end up with enriched but ungoverned databases. Understanding what data enrichment actually covers helps set realistic expectations.
What data quality metrics are NOT
They are not a one-time cleanup project. Contact data decays at roughly 30% per year (people change jobs, companies merge, phone numbers rotate). Freshness must be monitored continuously, not measured once and filed away. They are also not a vanity KPI. If you can't tie a metric to an action (merge, enrich, block, retrain routing), it is noise. Every metric in your dashboard should have a remediation path attached. Otherwise, you're just decorating a spreadsheet.
When to skip heavy measurement
Not every team needs a 20-metric dashboard on day one.
● Low volume / early stage: A "minimum viable" metric set is enough: bounce rate, duplicate rate, and required-field completeness.
● Unstable CRM processes: If lifecycle stages are undefined and field definitions change monthly, fix the definitions first, then measure.
● No remediation capacity: If you can't act on what you find, start with prevention: tighter forms, validation at point of capture, and enrichment before records enter the CRM rather than after.
Making it operational: dashboards, owners, and a monthly rhythm
A predictable cadence turns data quality from a project into a habit.
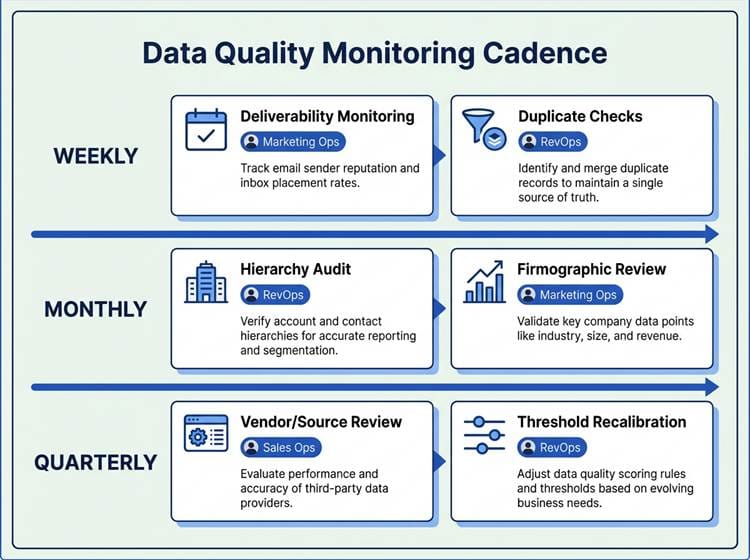
Ownership matters more than tooling. RevOps typically owns CRM data rules and lifecycle definitions. Marketing Ops owns lead data quality from inbound sources and enrichment vendor management. Sales Ops owns contact data hygiene within active pipeline. Assign each metric to a team, not to "everyone," because shared ownership is no ownership. (I've seen this pattern kill data quality programs more often than bad tooling does.)
Cadence keeps the system honest. Weekly: monitor deliverability and duplicate rates. Monthly: audit account hierarchies and firmographic accuracy. Quarterly: review vendor and source performance, recalibrate thresholds. Route alerts to the right queue automatically, document every fix, and prevent reintroduction through integration rules and validation at every entry point.
How Bitscale fits: AI prospecting and enrichment without wrecking CRM data quality
Enrichment tools are only as good as the quality controls around them. Bitscale's data enrichment solution is built as a quality-first layer: it enriches contact and company data with validation baked in, provides source transparency so you know where each field value came from, and supports controlled writes back to your CRM rather than bulk overwrites.
Where enrichment directly improves your metrics: coverage (filling missing fields for personalization and routing), freshness (re-verifying records against live sources), and accuracy (cross-referencing multiple providers before committing a value). For a safe rollout, start with a segment like your ICP Tier 1 accounts, measure completeness and validity before and after enrichment, then expand based on results. This keeps your CRM clean while improving the lead and customer data your team relies on daily.
Key takeaways
● Data quality metrics span six core dimensions: accuracy, completeness, freshness, uniqueness, consistency, and validity.
● Contact-level metrics (email validity, title correctness, duplicate rate) directly govern outbound deliverability and connect rates.
● Company-level metrics (firmographic accuracy, hierarchy integrity, coverage) protect segmentation, territory assignment, and pipeline reporting.
● CRM-level metrics (consistency, integrity, process alignment) determine whether your system of record is telling the truth.
● A metric without a remediation path is a vanity KPI. Every metric needs an owner, a threshold, and a defined action when that threshold is breached.
● Start with five: bounce rate, duplicate rate, completeness %, validity %, freshness %. Baseline them this week and assign an owner plus a remediation path for each.
Ready to fix your data quality metrics? Start enriching and validating contact data with Bitscale.
Frequently Asked Questions
What are the most important data quality metrics for B2B contact data?
The five most impactful metrics are email validity rate (target ≥ 95%), completeness percentage for required outbound fields (target ≥ 90%), freshness percentage within your defined decay window (target ≥ 80%), duplicate rate (target ≤ 5%), and bounce rate (target ≤ 2-3%). These directly govern deliverability, personalization quality, and sequence efficiency.
How do you measure CRM data quality without auditing every record?
Use statistical sampling combined with automated validation rules. Pull a random sample of 5-10% of records per segment (by source, region, or ICP tier), run field-level checks (validity, completeness, consistency), and extrapolate. Automate ongoing checks with CRM workflow rules or a data quality tool that flags records failing defined thresholds in real time.
What's a good bounce rate for cold outreach, and how does it relate to data quality?
A bounce rate at or below 2-3% is considered healthy for cold outbound. Rates above 5% almost always indicate stale contact data, missing email validation at capture, or a low-quality data source. Bounce rate is one of the most direct, real-time signals of email validity and overall contact data freshness.
How often should you refresh customer data and lead data in a CRM?
It depends on the field. Job titles and phone numbers should be re-verified every 60-90 days. Company firmographics (employee count, revenue band) are stable enough for quarterly checks. Email addresses benefit from validation before every major outbound campaign. Intent signals and tech-stack data should be refreshed monthly or in real time if your tooling supports it.
What's the difference between contact data quality metrics and company database quality metrics?
Contact data quality metrics evaluate person-level fields: email validity, phone reachability, title accuracy, seniority, and duplicate contacts. Company database quality metrics evaluate account-level fields: industry classification, employee count, revenue band, HQ location, parent/child hierarchy, and coverage of firmographic or technographic fields. Both feed different GTM workflows. Contact metrics protect outbound and inbound sequencing; company metrics protect segmentation, territory assignment, and pipeline rollups.

Sanket
CEO | Co-Founder Bitscale
Sanket is the CEO and Co-Founder of Bitscale. He leads company vision and strategy, building the future of AI-driven sales intelligence for modern B2B teams. Sanket is obsessed with the intersection of AI and go-to-market, and has spent years studying how the best B2B companies find, engage, and convert customers at scale. He writes about company building, product strategy, and where AI is taking the sales industry.
Read other blogs
All Blogs
Multi-Channel Outbound: How Modern Teams Win More Meetings
Multi-channel outbound strategy for B2B: use AI research, enrichment, intent signals, and CRM sync to prioritize accounts and book more meetings.

LinkedIn Prospecting: A Practical Guide for Modern Revenue Teams
LinkedIn prospecting for B2B teams: AI research, enrichment, intent signals, and CRM sync to prioritize accounts, improve outreach, and build pipeline.

Cold Email Automation: A Practical Guide for Revenue Teams
Cold email automation in 2026: AI research, enrichment, verification, intent scoring, and CRM sync to lift reply rates and build reliable outbound pipeline.