The SDR Metrics That Actually Matter in 2026
Table of Contents
Explore Bitscale
Find decision makers, more insights and contact information about this company on Bitscale
AI can now fire off ten thousand personalized emails before your SDR finishes their morning coffee. That is the 2026 reality. Activity is cheap. Attention is brutally expensive. The old scorecard (dials made, emails sent, sequences launched) tells you almost nothing about whether pipeline will materialize next quarter. If your SDR metrics still reward volume, you are measuring noise and ignoring signal.
This piece is for SDR leaders, RevOps teams, founders running lean sales orgs, and SDRs who want a fair scorecard. You will walk away with the small set of SDR performance metrics that actually correlate with pipeline, targets that reflect reality, and a coaching approach built on data rather than gut feel. We prioritize decision-making metrics over vanity metrics, and we show you how to instrument them practically.
What changed in 2026, and why old scorecards lie
Three shifts broke the traditional SDR metrics model:
- AI made outbound volume infinite: Data enrichment and AI prospecting let anyone generate thousands of touches per week. 'Emails sent' stopped being a differentiator and became table stakes.
- 'Sent' no longer means 'seen.': Inbox providers got smarter, spam filters got stricter, LinkedIn throttled automation harder. You need metrics that start at verified reach, not at the send button.
- Buying committees front-load their research: The SDR's job is to find and engage potential customers at the top of the pipeline. But the window where an SDR can actually influence an outcome has compressed. Timing and relevance now outweigh persistence.
If a metric can be inflated without improving pipeline, it is not a KPI. It is a smoke alarm at best.
A simple model for SDR performance metrics
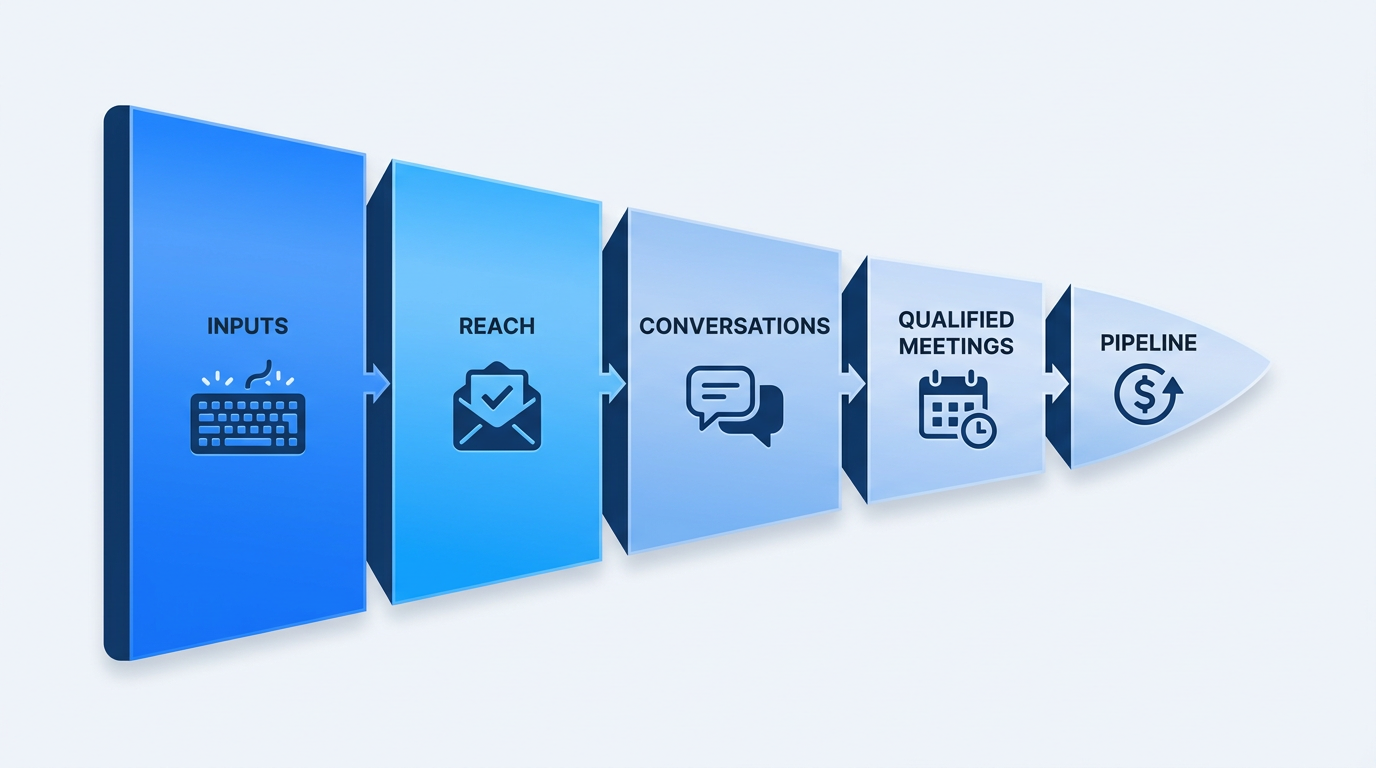
Every SDR metric should map to one of these five funnel layers.
Before picking metrics, agree on a shared mental model. Here is ours: Inputs (the work an SDR does) flow into Reach (messages that actually land) into Conversations (two-way exchanges) into Qualified Meetings into Pipeline. Each layer has metrics an SDR can control, influence, or cannot control at all. Your comp plan should reflect that distinction. Paying someone for pipeline dollar amounts they cannot influence breeds frustration. Paying only for meetings they fully control breeds calendar stuffing.
The 12 SDR metrics that actually matter (and the 6 you should demote)
These SDR metrics fit into four funnel layers. Each layer contains three metrics that, together, give you a complete picture of rep performance from first touch to closed pipeline. Below the core twelve, you will also find six vanity activity counts that should lose KPI status and move into diagnostics where they belong.
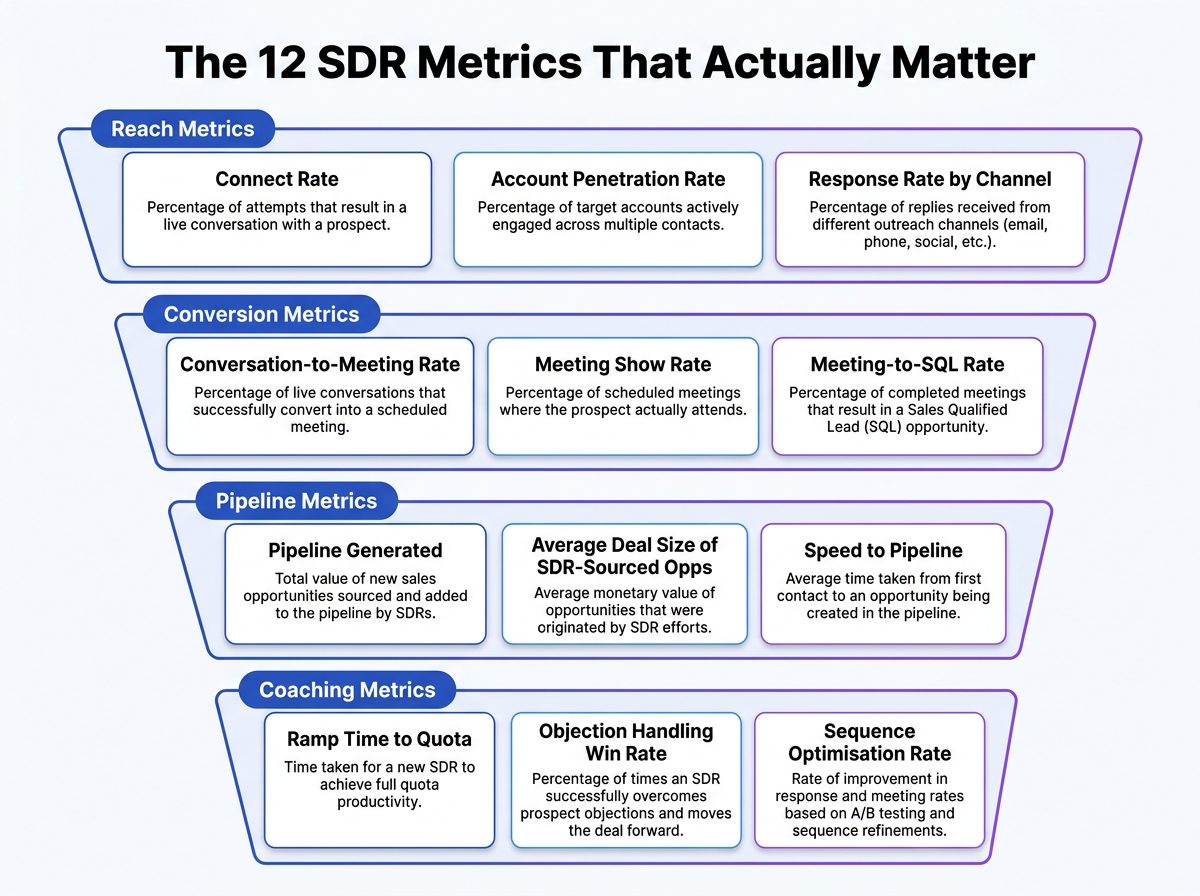
The 12 SDR metrics that matter, grouped by the four funnel layers every outbound team should track.
Reach Metrics sit at the top of the funnel and measure whether your SDRs are actually getting in front of the right people. Track these three:
(1) Connect Rate, the percentage of outreach attempts (calls, emails, LinkedIn messages) that result in a live conversation or meaningful reply. A low connect rate usually signals bad data, poor timing, or misaligned channel selection.
(2) Account Penetration Rate, which tracks how many distinct contacts within a target account your rep has engaged. Multi-threading into two or three personas per account dramatically increases the odds of generating a qualified opportunity.
(3) Response Rate by Channel, the reply rate broken out across email, phone, LinkedIn, and any other channel in your sequence. This metric tells you where your messaging resonates and where you are burning through lists with little return, so you can reallocate effort to the channels that actually produce conversations.
Conversion Metrics reveal how effectively reps turn conversations into qualified pipeline. Track these three:
(1) Conversation-to-Meeting Rate, the share of meaningful conversations that result in a booked meeting. If this number is low while connect rate is healthy, the problem is messaging or qualification, not activity.
(2) Meeting Show Rate, the percentage of booked meetings where the prospect actually attends. A declining show rate often points to weak confirmation sequences or poor prospect fit.
(3) Meeting-to-SQL Rate, which measures how many attended meetings convert into sales-qualified leads. This is the single best indicator of whether your SDR team is sending the right opportunities to AEs.
Pipeline Metrics connects SDR activity directly to revenue outcomes. The three here are:
(1) Pipeline Generated ($), the total dollar value of opportunities sourced by each SDR in a given period. This is the north star for any outbound program.
(2) Average Deal Size of SDR-Sourced Opps, which helps you understand whether reps are targeting the right segment or drifting into smaller, lower-value accounts.
(3) Speed to Pipeline, the average number of days from first outreach touch to a qualified opportunity entering the CRM. Shorter cycles usually indicate strong targeting and sharp messaging.
Coaching Metrics give managers the data they need to develop reps, not just evaluate them. Track:
(1) Ramp Time to Quota, the number of days or weeks a new SDR takes to hit full quota. Tracking this across cohorts reveals whether your onboarding process is improving.
(2) Objection Handling Win Rate, the percentage of calls where a rep successfully navigates a stated objection and still books a meeting. Call recording tools make this measurable at scale.
(3) Sequence Optimization Rate, which tracks how often a rep tests new subject lines, call scripts, or step timing within their sequences. Reps who iterate outperform those who run the same playbook on autopilot.
Now, the demoted six: raw dials per day, emails sent, sequences launched, LinkedIn connection requests sent, "activities logged," and total accounts in sequence. Don't delete them from your dashboard. They still matter as diagnostics. If an SDR's conversation rate drops, check whether dial volume also fell off a cliff, or whether they shifted into lower quality accounts. But none of these belong as a KPI. Every one can be inflated without moving pipeline a single dollar. Incentivize them and your team will prove that to you fast.
SDR outbound metrics that measure reach, not just effort
Verified deliverability rate is the first metric most teams should fix. If 20% of your emails bounce or land in spam, every downstream conversion metric is built on a lie. Track deliverability at the domain and mailbox level, not as a blended average. One burned domain can tank your entire outbound program. Remediation starts with domain health audits, proper warm-up sequences, list hygiene, and enrichment validation from reliable B2B data providers.
Unique ICP accounts touched per week forces breadth. Without it, SDRs naturally gravitate toward familiar accounts, grinding the same list until it is exhausted. The ICP filter is critical: touching 100 accounts that do not fit your ideal profile is worse than touching 30 that do.
First-touch speed to intent signals separates reactive teams from proactive ones. A prospect visits your pricing page or changes jobs, and the clock starts. Hours matter. Days kill the opportunity.
What most teams get wrong: optimizing for replies, not conversations
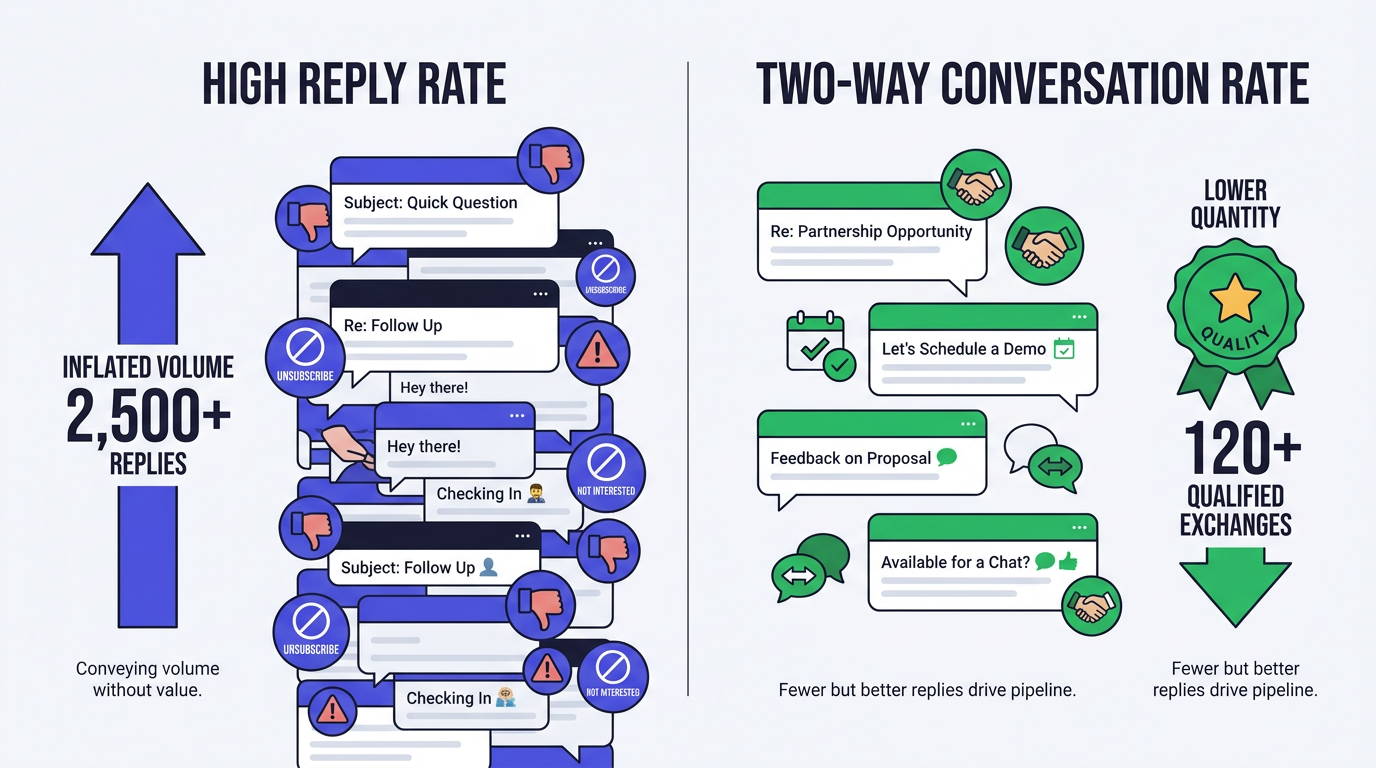
Reply rate can climb while pipeline falls. Measure conversations, not just responses.
Reply rate is the metric that fools most teams. It can go up while pipeline goes down. Negative replies ('not interested,' 'remove me'), wrong-persona responses, and bait copy that generates curiosity but attracts unqualified prospects all inflate the number. Instead of tracking raw reply volume, segment replies by quality and intent. High-quality data is the foundation for this; a platform like Bitscale's Data Enrichment can verify contacts and provide the firmographic data needed to focus on qualified replies.
The better north star for early funnel health is two-way conversation rate: the percentage of outreach that generates a genuine back-and-forth exchange. If your positive reply rate looks healthy but meetings are low, the problem is not your SDR's prospecting. It is your handoff process, your qualification criteria, or your CTA. Diagnose before you coach.
Conversion metrics that predict meetings and protect quality
Conversation-to-meeting-set rate, segmented by persona and market segment, is the cleanest indicator of whether messaging and targeting are working in tandem. A strong rate with enterprise VPs but a weak one with mid-market directors tells you something specific and actionable.
Meeting held rate (show rate) is the next checkpoint. Low show rates almost always trace back to weak expectation-setting during the booking process, not flaky prospects. If the prospect does not understand what the meeting is about or why it is worth 30 minutes of their day, they will not show up.
Qualified meeting rate is your quality gate. A common benchmark for outbound SDRs is between 8 and 15 qualified meetings per month. Top-quartile SDRs can generate 12 to 15 qualified meetings per month, while the median sits at 8 to 10. Tracking this metric with a tool like Bitscale's AI Agent helps automate the research and qualification process, ensuring reps focus on the best accounts. You should also track disqualification reasons as a distribution, not just a count. If 40% of disqualifications are due to 'wrong company size,' that is a targeting problem you can solve with better data, not a skill problem.
Pipeline metrics: the scoreboard that aligns SDR, AE, and leadership
Pipeline created per SDR (sourced) is the metric leadership cares about most, and rightly so. High-performing B2B sales development teams see SDR-sourced pipeline contributions of $3M to over $8M annually per rep, depending on the average contract value (ACV). But this number only works if your attribution model is consistent. Define 'SDR-sourced' clearly: did the SDR create the first contact? Book the first meeting? Or was the opportunity already in the CRM from marketing? Pick one definition and stick with it across quarters.
Stage progression rate for SDR-sourced opportunities (percentage reaching Stage 2 or 3 within 14 to 21 days) separates real pipeline from 'pipeline theater.' If SDR-sourced deals stall at Stage 1 while inbound deals progress, you have a quality gap. Compare win rate and average selling price between SDR-sourced and non-SDR-sourced opportunities. The average SDR-sourced close rate is 15 to 20%, with top performers achieving 25 to 30%. If your SDR-sourced win rate is significantly below that range, the issue is upstream: targeting, enrichment, or qualification.
Mini case study: same output, two very different pipelines
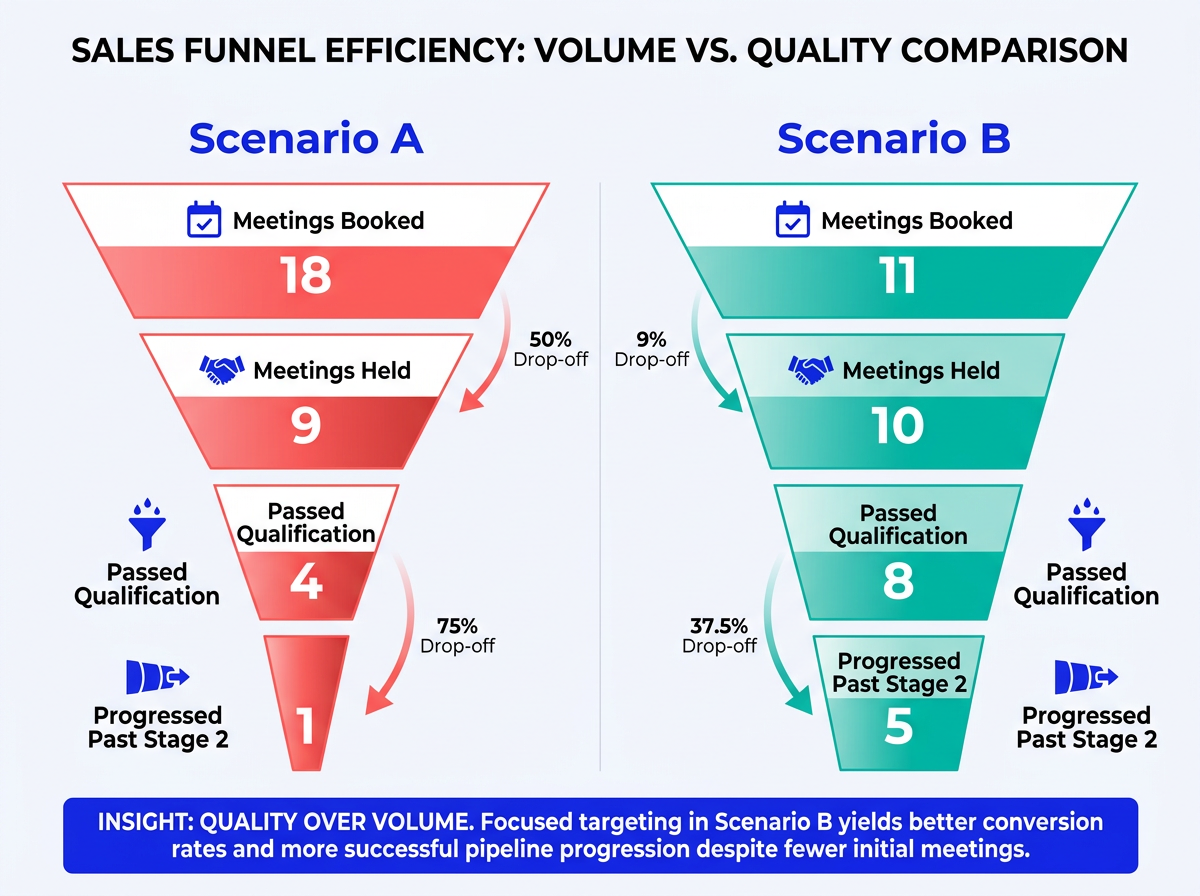
Fewer meetings with better targeting consistently outperforms high-volume calendar stuffing.
Scenario A: An SDR books 18 meetings in a month. Looks great on the surface. Nine are held, 4 pass qualification, 1 progresses past Stage 2. Root cause: broad targeting, weak ICP filtering, and incentives that reward calendar entries.
Scenario B: A different SDR books 11 meetings. Ten are held, 8 pass qualification, 5 progress past Stage 2. The difference: intent-based routing, enriched contact data confirming persona fit before outreach, and a CTA that sets clear expectations. I have watched this pattern play out at three different orgs now, and the conclusion is always the same: fewer, better-targeted meetings win.
This is exactly why tools that combine AI prospecting with deep enrichment redefine what 'good' looks like. When you are building a modern prospecting stack that validates ICP fit before the first touch, your SDRs spend less time chasing ghosts and more time in conversations that convert. Bitscale's approach to enrichment and AI prospecting is built around this principle: quality inputs produce quality pipeline.
Coaching metrics: improving humans, not dashboards
Time-to-first-meeting for new SDRs is your ramp metric. A new hire in an SMB motion taking more than three weeks to book a qualified meeting signals something off in onboarding, enablement, or list quality. For enterprise motions, six to eight weeks is more realistic. Track it by segment so you do not compare apples to aircraft carriers.
From call recordings and outreach data, track these coaching signals:
- Talk-to-listen ratio: SDRs who talk more than 60% of the time on discovery calls consistently produce lower-quality meetings.
- Question depth: Are they asking follow-up questions or just reading a script? This is a leading indicator of meeting quality that surfaces weeks before pipeline numbers do.
- Personalization depth score: A 1-to-5 rubric based on specificity (company reference, persona pain, trigger event mention), tied to conversion data so you can see where personalization stops adding lift.
- Follow-up latency after engagement: When a prospect opens an email, clicks a link, or visits a page, how fast does the SDR respond? The average connect rate for cold calls is 5 to 8%, while a good rate is 8 to 12%. Speed to follow-up is one of the few levers that reliably moves connect rates upward.
Build a 2026 SDR scorecard in 60 minutes
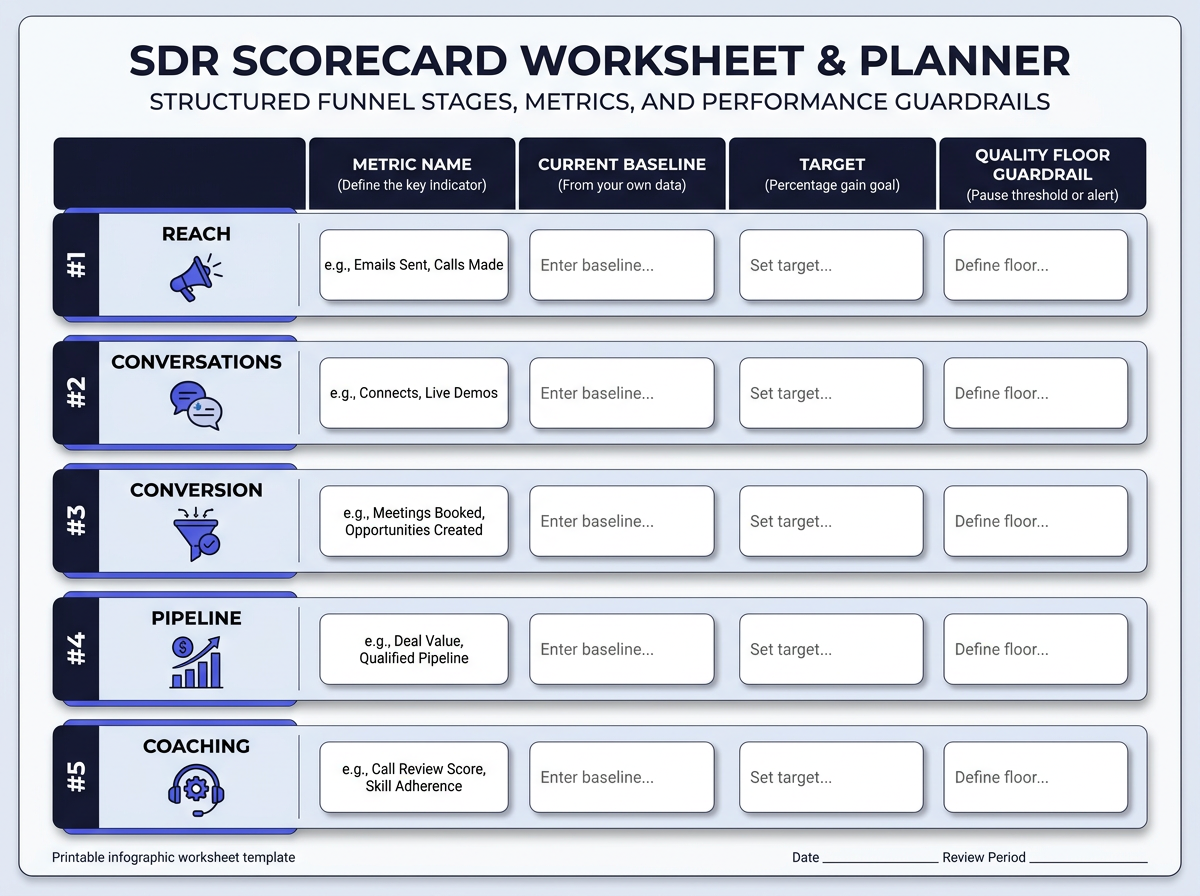
Pick one metric per layer, set baselines from your own data, and add quality floors to prevent gaming.
Pick one metric per funnel layer: verified deliverability rate (Reach), two-way conversation rate (Conversations), qualified meeting rate (Conversion), pipeline created (Pipeline), and follow-up latency or personalization depth (Coaching). Five metrics. That is your scorecard.
Set targets using your own baselines, not arbitrary industry benchmarks. Measure the current state for two to four weeks, then set improvement targets as percentage gains ('improve qualified meeting rate from 35% to 42% this quarter'). Create guardrails: quality floors that prevent gaming. Example: if qualified meeting rate drops below 30%, the SDR's meeting-set bonus pauses regardless of volume. This single guardrail eliminates most calendar-stuffing behavior overnight.
The weekly SDR performance review that does not feel like punishment
Keep it to 30 minutes. The first 10 are pure numbers: where does each SDR stand against their five scorecard metrics? No storytelling, just data. The next 15 go to deal and meeting quality: pick two or three meetings from the week, listen to snippets, discuss what worked and what didn't.
The final 5 minutes are for experiments. Each SDR picks one small behavior change ('I will follow up within 30 minutes of every email open this week') and commits to a two-week sprint. These micro-experiments compound surprisingly fast.
Segment your dashboard by persona, industry, and channel before the meeting. Blended averages hide the truth. An SDR might have a 50% show rate with directors of engineering and a 15% show rate with CFOs. That is not a skill problem; it is a targeting signal. If your scalable GTM automation stack is set up correctly, these segments should be one click away.
Fixing the three most common SDR outbound metrics problems
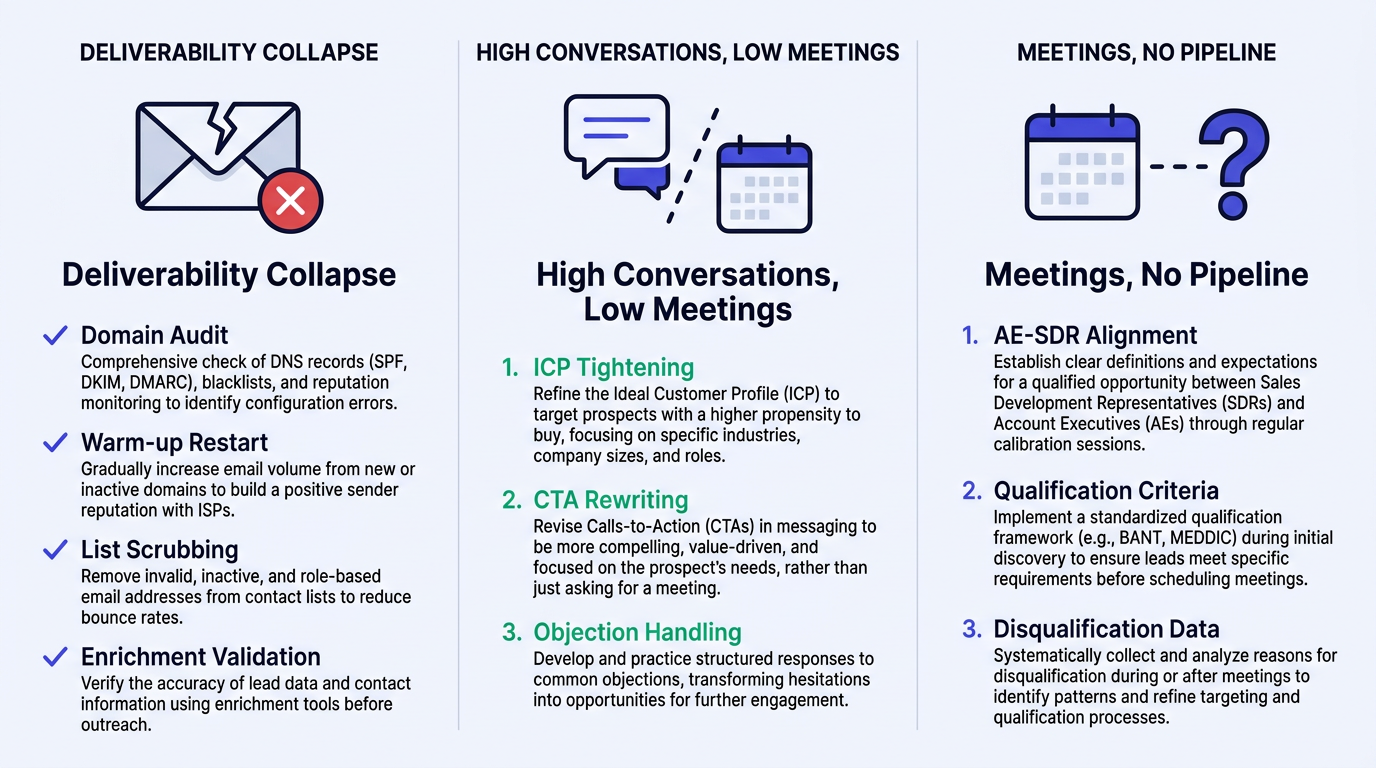
Three problems, three remediation paths. Diagnose before you coach.
Problem 1: Deliverability collapse. Your emails are going to spam. Audit domain health (SPF, DKIM, DMARC), restart warm-up on burned domains, scrub your list for invalid addresses, and validate enrichment data before loading it into sequences. If your enrichment provider has stale data, switch providers. Do not throw more volume at a broken sending infrastructure.
Problem 2: High conversations, low meetings. SDRs are getting replies but cannot convert them. Tighten your ICP filter so conversations happen with the right people. Rewrite your meeting CTA to be specific about what the prospect gains from the call. Train objection handling for the three most common pushbacks your team hears.
Problem 3: Meetings happen, pipeline does not. This is an AE-SDR alignment issue. Redefine qualification criteria together. Agree on what 'next step' means before the meeting happens. If the AE consistently rejects SDR-sourced meetings, the problem is either the SDR's qualification bar or the AE's expectations, and you need disqualification reason data to determine which.
Advanced: segmenting SDR metrics so they actually mean something
A single blended 'meeting held rate' across your entire SDR team is almost useless. Segment by motion first: SMB, mid-market, and enterprise have fundamentally different cycle lengths, and what counts as 'good' varies dramatically. An enterprise SDR booking 6 qualified meetings per month might be outperforming an SMB SDR booking 12, depending on deal size and complexity.
Segment by channel mix next. An SDR running a phone-first motion will have different reach and conversation metrics than one running email-first or LinkedIn-first. Without segmentation, you will accidentally penalize the wrong behavior. Run cohort analysis by list source, enrichment completeness, and intent tier. You will often discover that the gap between a top performer and a median performer is not skill but the quality of the list they were handed.
One more thing: apply basic sample size sanity checks. If an SDR has only booked 4 meetings this month, do not 'coach' their 25% show rate. That is noise, not signal.
Stop paying SDRs on meetings set (an opinionated aside)
Meeting-based compensation creates predictable bad behavior. SDRs optimize for the metric they are paid on, and if that metric is 'meetings booked,' you will get calendar stuffing, loose qualification, and friction with AEs. I have seen this play out enough times to call it a law of SDR physics.
A pragmatic alternative: a blended plan using qualified meetings (40% weight), pipeline created (40%), and a team-based kicker (20%) tied to overall SDR-sourced pipeline coverage. Roll it out without mutiny by running a one-month shadow score where SDRs see what their comp would have been under the new model. Then shift weighting gradually over the next quarter.
The SDR metrics stack to run in 2026, and what to do Monday morning
The metrics that matter fit on one hand: two-way conversation rate, meeting held rate, qualified meeting rate, pipeline created per SDR, and stage progression rate. Everything else is a diagnostic, not a KPI.
Your Monday morning checklist:
- Audit your current metric definitions for consistency.
- Pick one metric per funnel layer for your scorecard.
- Measure baselines for two weeks.
- Set improvement targets as percentage gains.
- Run one two-week coaching experiment focused on a single controllable behavior.
SDR metrics exist to drive decisions. If a number does not change what you do next, delete it from your dashboard. The teams that win in 2026 are not the ones with the most data. They are the ones with the clearest signal, the fastest response to that signal, and the enrichment infrastructure to act on it before the window closes.
SDR metrics are only useful when they help teams act faster. In 2026, the winning SDR teams will not be the ones tracking the most numbers. They will be the ones using cleaner data, sharper signals, and faster workflows to turn the right accounts into real pipeline. Bitscale helps GTM teams build that foundation by combining data enrichment, AI research, and prospecting workflows in one place.
Frequently Asked Questions
What are the most important SDR metrics to track in 2026?
Five SDR metrics stand out as essential: qualified meetings booked, pipeline generated, conversation rate, sales cycle length at the SDR stage, and sales acceptance rate. Together, these cover output, efficiency, and lead quality. They give revenue leaders a full-funnel view of performance and are difficult to game, which makes them reliable indicators of genuine SDR impact.
Should SDRs be compensated on meetings, pipeline, or something else?
A blended compensation model tends to produce the best results. Paying only on meetings set incentivizes low-quality volume, while tying compensation entirely to pipeline holds SDRs accountable for outcomes they can't fully control (like an AE's closing ability). A common and effective split is 40% on qualified meetings, 40% on pipeline created, and 20% as a discretionary or team-based bonus. This structure rewards both quantity and quality.
What are good benchmarks for key SDR conversion metrics?
Benchmarks shift by industry and segment, but general 2026 ranges include a 3% to 8% conversation rate from outreach, a 70% to 85% meeting show rate, and a 60% to 80% qualified meeting rate (AE-accepted). Top-quartile SDRs typically book 12 to 15 qualified meetings per month. That said, your own historical data is always the most meaningful baseline for setting realistic targets.
How do you measure SDR-sourced pipeline without attribution conflicts?
Keep the rule simple and enforce it consistently. A widely used model is: if the SDR initiates the first qualified meeting with an account, that opportunity counts as SDR-sourced. Log this at the point of opportunity creation. While multi-touch attribution works well for marketing analysis, applying it to SDR compensation often creates unnecessary friction and disputes.
How often should teams review SDR metrics to stay on track?
Weekly reviews of activity and conversion data keep SDR teams aligned with targets and allow managers to course-correct quickly. Monthly or quarterly reviews are better suited for evaluating pipeline contribution, sales acceptance rates, and overall quota attainment. Pairing short-cycle check-ins with longer strategic reviews ensures that both daily execution and broader performance trends receive the attention they need.

Sanket
CEO | Co-Founder Bitscale
Sanket is the CEO and Co-Founder of Bitscale. He leads company vision and strategy, building the future of AI-driven sales intelligence for modern B2B teams. Sanket is obsessed with the intersection of AI and go-to-market, and has spent years studying how the best B2B companies find, engage, and convert customers at scale. He writes about company building, product strategy, and where AI is taking the sales industry.
Read other blogs
All Blogs
AI Search and B2B SEO: How Modern GTM Teams Win Visibility in the Age of ChatGPT and Perplexity
AI search and B2B SEO: align AEO, schema, entities, and GTM teams to earn citations in ChatGPT, Perplexity, and Google AI Overviews.
The CAC Payback Crisis: Why Traditional MQLs No Longer Drive Efficient Growth
CAC payback is rising in B2B SaaS. See why MQL-first funnels waste spend, and how intent signals, AI research, and governance improve revenue efficiency.

How Modern GTM Teams Use Agentic Workflows for Deep Account Research
Agentic workflows for deep account research: stages, platform tradeoffs, AI vs human roles, and governance guardrails to keep CRM data clean and useful.