Sales Productivity Metrics Every Revenue Leader Should Track
Table of Contents
Explore Bitscale
Find decision makers, more insights and contact information about this company on Bitscale
Most sales reps spend a minority of their working hours actually selling; the rest gets absorbed by admin work, internal meetings, and the operational overhead that comes with running a modern GTM motion (Forbes, 2025). That reality should force a hard look at the sales productivity metrics you track and, more importantly, the ones you use to change behavior. If most of a rep's day is CRM upkeep, internal syncs, and manual research, then measuring "calls made" or "emails sent" mostly tells you who's busy, not what's driving revenue.
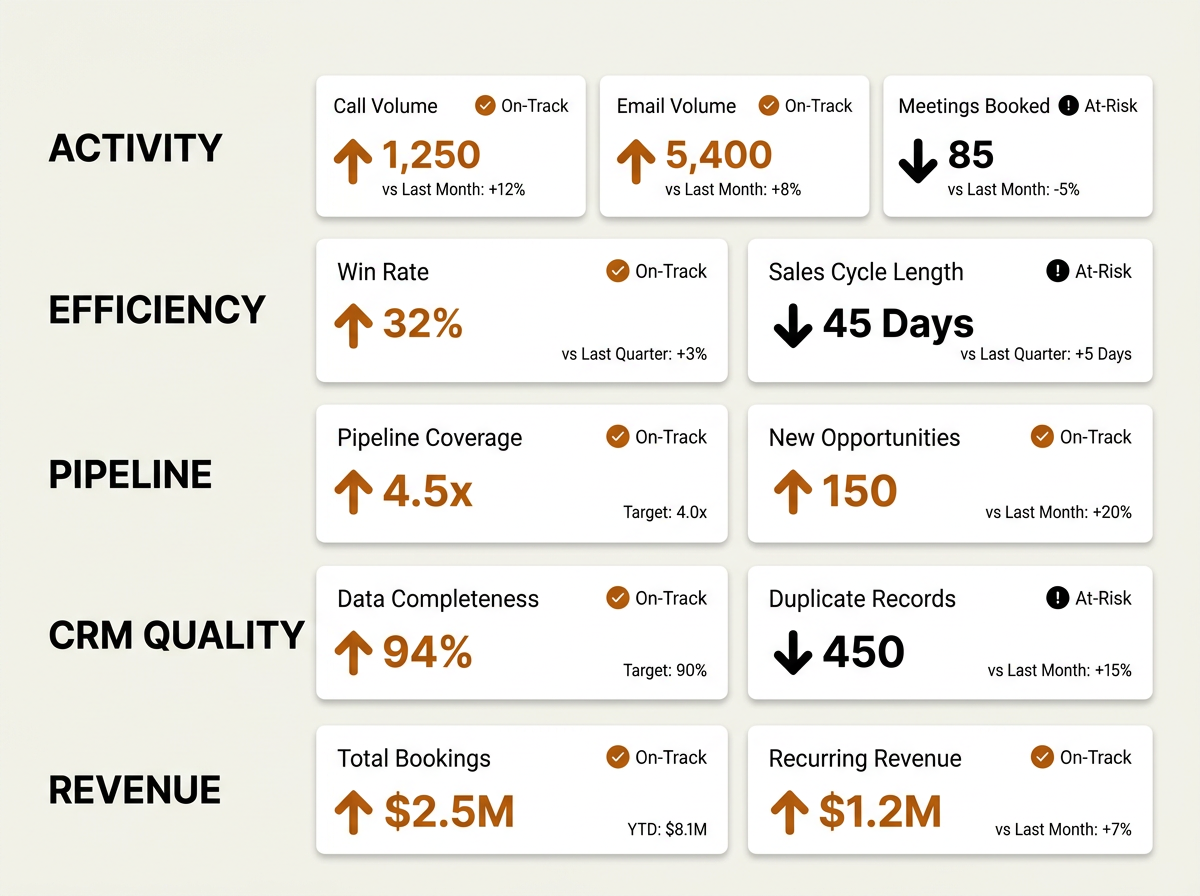
This piece breaks measurement into five categories that show up again and again in high-functioning B2B revenue orgs: activity, efficiency, pipeline, CRM quality, and revenue metrics. For each category, you'll get the why, how to read it without fooling yourself, the failure modes that make teams chase noise, and where AI analytics is changing what's practical to measure. The audience can vary (SDR leaders, AE managers, RevOps, the exec team) but the job is consistent: trade gut feel for signal that ties day-to-day execution to business outcomes.
Why Most Sales Dashboards Measure the Wrong Things
A Harvard Business Review study examining a large sample of sales organizations found that the KPIs teams rely on most are lagging indicators like closed deals and quota attainment (HBR, 2017). Lagging indicators are a scoreboard: they tell you what happened after the fact. They won't explain why the quarter derailed or what to change in time for next month. The leverage is in leading indicators, the upstream behaviors, conversion rates, and pipeline signals that point to future revenue before the quarter is over.
That split matters because dashboards built around lagging outcomes train everyone to be reactive. Managers step in after the miss. Reps change course after a bad month. RevOps escalates data problems after the forecast has already been embarrassed. Moving to a balanced scorecard, leading indicators alongside lagging results, is one of the highest-return changes most B2B teams can make to how they run sales analytics.
The Five Strategic Measurement Categories
Instead of tossing fifty KPIs into a spreadsheet and hoping something sticks, group your sales productivity KPIs into five buckets with clear jobs to do. The table below ties each category to the question it answers and the teams that get the most value from it.
| Category | Core Question It Answers | Primary Stakeholders |
|---|---|---|
| Activity Metrics | Are reps doing enough of the right work? | SDRs, frontline managers |
| Efficiency Metrics | How well do reps turn effort into outcomes? | AEs, sales operations |
| Pipeline Metrics | Is the pipeline healthy enough to hit targets? | AEs, RevOps, leadership |
| CRM Quality Metrics | Can we trust the data behind our decisions? | RevOps, sales operations |
| Revenue Metrics | Are we generating profitable, predictable growth? | Leadership, finance, RevOps |
| Each category answers a different strategic question. Tracking all five prevents blind spots. |
Activity Metrics: Necessary but Insufficient
Calls logged, emails sent, meetings booked. They're easy to count, which is exactly why they're easy to misuse. Activity metrics can confirm that reps are showing up, but they don't tell you whether the work is aimed at the right accounts or producing pipeline. The rep who books a high volume of meetings with unqualified prospects is less productive than the rep who books fewer meetings that actually convert.
The usual failure mode is treating volume as a stand-in for effort or skill. High activity paired with weak conversion is often a targeting issue, not a motivation issue. When AI sales analytics tools like Bitscale's AI Agent surface buying signals and enrich prospect data before outreach, reps can spend fewer touches on better-fit accounts. Activity totals might fall, but pipeline output improves, and your sales performance metrics should be built to recognize that trade.
Efficiency Metrics: Where Productivity Lives
Efficiency metrics answer a simple question: for each unit of input (time, cost, effort), how much output do you get back? Lead-to-opportunity conversion rate, deal cycle length, cost per acquisition, and revenue per rep are the staples. These are the numbers that separate teams that produce from teams that just look active.
Efficiency metrics worth tracking:
- Lead-to-opportunity conversion rate tells you whether marketing and SDR work is creating qualified pipeline, not just filling the top of the funnel.
- Sales cycle length (by segment and deal size) highlights where buyers get stuck. When cycles stretch, it often points to qualification, positioning, or a late-stage process problem.
- Revenue per rep makes output comparable across team size and remains one of the cleanest measures of B2B sales productivity.
- Cost of sale (total sales spend divided by new revenue) forces the productivity conversation to include profitability.
One misread shows up constantly: comparing cycle length across deal sizes as if they're the same motion. Enterprise deals take longer than mid-market by default. Roll them into a single average and you hide the signal you actually need. Break sales efficiency metrics out by deal tier, geography, and source channel so the comparisons are fair and the coaching is specific.
Pipeline Metrics: The Health Check Your Forecast Depends On
Pipeline coverage ratio, pipeline velocity, stage distribution, and deal aging are the core pipeline metrics. If efficiency tells you how well the engine runs, pipeline tells you whether you have enough fuel to finish the quarter. A common benchmark is a coverage ratio of around three times quota, but the right number depends on your historical win rate, average deal size, and sales cycle length. A team with a strong close rate can operate with less coverage than a team closing a smaller share of its opportunities.
Pipeline velocity, commonly calculated as (number of deals x average deal value x win rate) / sales cycle length, is one of the most actionable sales operations metrics because it compresses four levers into one. Improve any input and the math moves. Where teams go wrong is treating velocity as a monthly snapshot instead of a trend. One oversized deal can make a month look great on paper. A rolling average over a longer window (often 60 to 90 days, adjusted for your typical cycle) gives you a steadier read.
Deal aging is the metric most teams quietly avoid because it forces uncomfortable pipeline conversations. Opportunities that sit in the same stage well beyond the average stage duration become statistically less likely to close. The exact threshold varies by deal complexity and sales cycle, but many organizations flag deals that exceed roughly 1.5 times the typical stage duration as at-risk. Automating those flags, instead of hoping a manager catches it in a spreadsheet during pipeline review, is a practical place for AI-powered workflow automation to earn its keep.
CRM Quality Metrics: The Foundation Nobody Wants to Own
Everything above depends on the CRM being accurate and current. If key fields are missing, stages are stale, or close dates get pushed forward every week, your dashboards become confident-looking fiction. CRM quality metrics put numbers against the trustworthiness of your data layer.
Start with field completeness (what percentage of required fields are filled), data freshness (how recently records were updated), duplicate rate, and stage-update latency (how quickly deals are moved after key events). If you want a more structured approach, this guide on data quality metrics for RevOps lays out a solid framework. CRM hygiene is a quiet failure mode: it degrades every downstream report without a single obvious alarm bell.
Platforms like Bitscale try to fix the problem at the source by enriching contact and company records automatically through CRM sync, filling missing work emails, phone numbers, firmographics, and intent signals without forcing reps into manual research. When enrichment runs in the background, completeness improves without adding another admin tax to the rep's day.
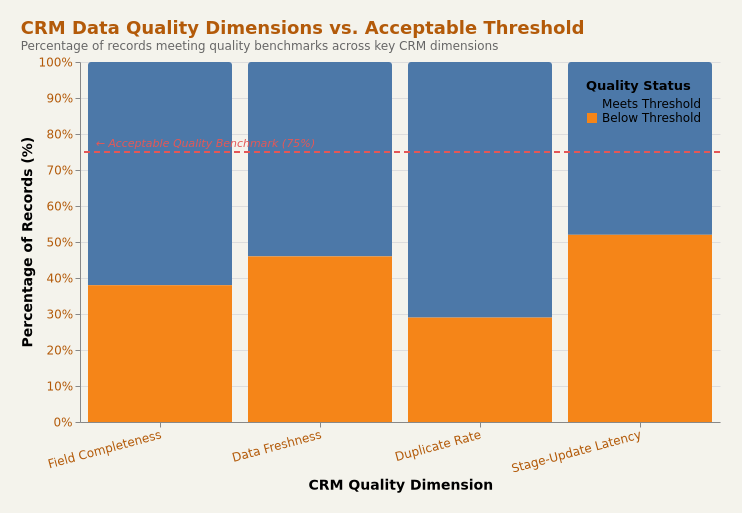
Four CRM quality dimensions reveal where missing or stale data quietly undermines sales productivity metrics.
Revenue Metrics: Connecting Activity to Business Outcomes
Revenue metrics sit at the top of the stack: annual recurring revenue (ARR), net revenue retention, customer acquisition cost (CAC), CAC payback period, and gross margin per sales dollar invested. They're what leadership and the board look at first. McKinsey research has consistently shown that top-performing B2B companies generate significantly higher gross margin for every dollar invested in sales compared to bottom-quartile peers (McKinsey, 2023). That spread isn't explained by sheer activity. It's explained by efficiency, pipeline quality, and better decisions made earlier.
The common mistake is treating revenue metrics as something to celebrate or mourn, instead of something to break down. When ARR growth slows, the diagnostic path should run back through the five categories: Is pipeline coverage there? Are conversion rates holding? Is cycle length creeping up? Are reps spending time on the right accounts? Revenue metrics are the scoreboard; the other four categories are where you find the levers.
Role-Based KPI Recommendations
Not every role needs every metric, and forcing it just creates noise. An SDR doesn't need CAC payback on their home screen. A CRO doesn't need to spend meeting time on raw activity counts. The table below maps KPIs to four core roles based on the decisions each role actually has to make.
| Role | Primary KPIs | Why These Matter |
|---|---|---|
| SDR | Qualified meetings booked, lead-to-meeting conversion rate, response rate by channel | SDRs shape top-of-funnel quality. Prioritizing qualified meetings over raw volume keeps incentives tied to pipeline value. |
| AE | Win rate, average deal size, sales cycle length, pipeline velocity | AEs own execution through the middle and bottom of the funnel. These metrics show deal quality and make the forecast more reliable. |
| RevOps | CRM field completeness, data freshness, forecast accuracy, pipeline coverage ratio | RevOps owns the systems and the data layer. These metrics show whether the org can make decisions on trustworthy numbers. |
| Leadership (VP/CRO) | Revenue per rep, CAC, net retention, gross margin per sales dollar | Leadership needs outcome KPIs tied to unit economics, capital efficiency, and predictable growth. |
| Align KPIs to the decisions each role actually makes. |
Traditional Activity Metrics vs. Modern Revenue Metrics
Modern measurement doesn't mean you stop tracking activity. It means you stop pretending activity is the story. "Calls made" becomes useful when you can say "calls made to qualified accounts showing intent." The comparison below shows how a traditional count turns into something you can actually coach and operationalize once it's paired with context.
| Traditional Metric | Limitation | Modern Alternative | What It Reveals |
|---|---|---|---|
| Calls made per day | Rewards volume over targeting | Calls to accounts showing buying signals | Whether reps prioritize high-intent prospects |
| Emails sent | Ignores relevance and personalization | Reply rate by persona and segment | Message-market fit and personalization quality |
| Demos scheduled | Counts meetings, not quality | Demo-to-opportunity conversion rate | Whether demos advance deals or waste time |
| Quota attainment (binary) | Pass/fail with no diagnostic value | Quota attainment trend + pipeline velocity | Whether performance is improving and sustainable |
| Number of new contacts added | Ignores data accuracy | Enriched contacts with verified emails and firmographics | Whether the CRM contains actionable, accurate records |
| Modern metrics add context that transforms raw counts into actionable intelligence. |
Sales teams commonly rely on a wide range of tools to manage productivity, and a growing share of sales operations professionals report plans to consolidate their stack to improve efficiency (Salesforce, 2025). That push makes sense: fragmented tools create fragmented data. When activity lives in one system, CRM data in another, and pipeline analytics somewhere else, getting a coherent view of sales productivity turns into manual stitching, slow, error-prone, and always a step behind reality.
How AI Improves Sales Productivity Measurement
AI changes measurement in three practical ways: it captures data automatically, it spots patterns humans miss, and it cuts down the manual work that keeps reps out of selling time. CRM enrichment is a straightforward example. Without automation, a rep researches a prospect, types in firmographics, looks up the tech stack, and checks for recent funding. That process is time-consuming and pulls reps away from revenue-generating conversations. With AI prospect research tools, enrichment can happen when the lead hits your system, not when a rep finally finds time, compressing what used to be a significant manual effort into seconds.
Bitscale positions itself as a unified GTM platform that brings AI prospect research, buying-signal detection, CRM enrichment, and ready-made sales workflows into one system. Instead of bouncing between a data provider, an enrichment tool, and a sequencing platform, teams can run research-to-outreach in a single place. In practice, that shows up as cleaner CRM data (lifting CRM metrics), faster qualification (lifting efficiency metrics), and better-targeted outreach (lifting pipeline metrics). For more on how this category is changing workflows, see how AI sales assistants are reshaping work across the revenue stack.
Companies with aligned revenue operations functions consistently grow faster than peers with siloed go-to-market teams (Gartner, referenced by CDP.com). AI can speed up that alignment by giving everyone a shared data layer. When SDRs, AEs, and RevOps are working from the same enriched, signal-rich records, the metrics become consistent enough to compare and act on. If you're evaluating where autonomous agents fit, Bitscale's view of agentic sales lays out a workable framework.
Common Mistakes That Undermine Your Metrics Program
Even with good intentions, metrics programs fail in predictable ways. These are the issues that come up most often when RevOps audits dashboards and reporting workflows.
Measuring everything, acting on nothing. A dashboard packed with dozens of metrics isn't a strategy; it's a screensaver. Limit each role to a focused set of KPIs, review them on a regular cadence, and tie every KPI to a specific action. If a metric never triggers a decision, it doesn't belong on the dashboard.
Confusing correlation with causation. If the rep who sends the most emails also closes the most deals, that doesn't prove email volume drives revenue. It may just be the best territory. Before you draw conclusions, segment by territory, deal size, and account quality so you're not coaching the wrong lesson.
Ignoring data quality. If a significant share of opportunity records are missing close dates or sitting in stale stages, your pipeline coverage ratio is theater. Fix CRM hygiene before you trust any downstream metric. Automated enrichment through platforms like Bitscale, or competitors like Clay and Apollo.io, can reduce the manual burden, but you still need the operational discipline to enforce standards.
Optimizing for metrics instead of outcomes. When reps learn that "meetings booked" is the top KPI, they'll book meetings with anyone willing to show up. Put quality gates next to volume (for example, meetings with ICP-fit accounts only) so the metric can't be gamed.
Building Your Sales Productivity Scorecard
A useful scorecard mixes leading and lagging indicators, covers all five measurement categories, and fits on a single screen. Here's a straightforward way to build one without turning it into a reporting project that never ends.
- Audit your current dashboard. Write down every metric you track today. For each one, ask: does this change a decision we make? If not, archive it.
- Map metrics to the five categories. Look for gaps. Most teams overweight activity and revenue and underweight CRM quality and efficiency.
- Assign ownership. Every metric needs one owner who monitors it, interprets it, and drives follow-through. Shared ownership usually means nobody owns it.
- Set review cadences. Establish a rhythm that fits your sales cycle and operational complexity. Many teams review activity and efficiency weekly, pipeline bi-weekly, and revenue metrics monthly or quarterly, but adapt the frequency to what actually drives timely decisions in your organization.
- Automate data capture. Manual tracking creates lag and introduces errors. Use CRM sync, enrichment, and sales intelligence solutions so data stays current without adding to rep workload.
Teams that do this well don't just measure more; they measure with intent. Upstream behaviors connect to downstream outcomes. Data gets trusted because someone is accountable for keeping it clean. AI gets used to remove the admin work that keeps reps away from the selling time that moves revenue. If you're evaluating tooling, this comparison of Bitscale, Clay, and Apollo lays out how different platforms support the workflow end to end.
A one-screen scorecard connects daily sales activity to quarterly revenue outcomes.
Key Takeaways
Sales productivity metrics pay off when they connect rep behavior to business outcomes. Track activity, but judge it alongside efficiency and pipeline health so you can see whether the work is producing revenue. Treat CRM data quality as non-negotiable, because every downstream metric depends on it. Use AI to automate capture, enrich records, and surface buying signals so reps spend more time selling. Give every KPI an owner, a review cadence, and a defined action when it moves. Keep the scorecard focused: a small, well-chosen set of KPIs per role, spanning the five categories, is typically enough to coach effectively, forecast with fewer surprises, and allocate resources with confidence.
Frequently Asked Questions
What is the difference between sales productivity metrics and sales performance metrics?
Sales performance metrics focus on outcomes like quota attainment and win rate. Sales productivity metrics are broader: they describe how inputs (time, effort, cost) translate into outputs (pipeline, revenue). Productivity metrics help explain why performance is trending up or down, not just whether it is.
How many KPIs should an SDR team track?
A focused set of KPIs, typically in the range of five to seven, is a practical starting point for most teams. Prioritize qualified meetings booked, lead-to-meeting conversion rate, response rate by channel, and activity volume against ICP-fit accounts. The exact count depends on your team's maturity and reporting needs, but going much beyond that range tends to fragment attention and make coaching less effective.
How does AI improve forecast accuracy in revenue operations?
AI improves forecast accuracy by reducing CRM decay (stale stages, missing fields), flagging risk signals like slipping close dates or disengaged stakeholders, and using historical patterns to identify deals that are unlikely to close. Platforms like Bitscale also help by enriching opportunities with firmographic and intent data, giving RevOps a fuller picture of what is really in the pipeline.
What are the most important CRM metrics for revenue operations teams?
Start with field completeness rate, data freshness (average days since last update), duplicate record rate, and stage-update latency (time between a deal event and the CRM update). Together, these show whether the CRM is reliable enough for forecasting and reporting.
Should we replace activity metrics with revenue metrics entirely?
No. Activity metrics still matter for frontline management and for reps building consistent habits. The change is about context, not removal. Pair activity counts with quality signals (activities against ICP-fit accounts) and efficiency ratios (meetings per 100 outbound touches) so volume is always evaluated alongside relevance.

Sanket
CEO | Co-Founder Bitscale
Sanket is the CEO and Co-Founder of Bitscale. He leads company vision and strategy, building the future of AI-driven sales intelligence for modern B2B teams. Sanket is obsessed with the intersection of AI and go-to-market, and has spent years studying how the best B2B companies find, engage, and convert customers at scale. He writes about company building, product strategy, and where AI is taking the sales industry.
Read other blogs
All Blogs
SalesIntel Review: Human-Verified Data vs Waterfall Enrichment
SalesIntel review: human-verified data, pricing, intent, and CRM enrichment vs waterfall enrichment platforms like Bitscale for coverage and automation.

RocketReach Review: Is a Huge Contact Database Enough for B2B Prospecting?
RocketReach review: pricing, data accuracy, integrations, and when it breaks down for scaled outbound. See when a GTM platform like Bitscale fits better.

UpLead Review: Data Accuracy, Pricing and Fit for Prospecting Teams
UpLead review covering 95% accuracy, pricing, CRM integration limits, and when teams should switch to a broader GTM platform like Bitscale.